
Circle Graph or Pie Chart
Circle Graph or Pie Chart: Overview
This topic covers concepts, such as Characteristics of Pie Charts, Pie Chart of Data, Understanding Pie Charts, Understanding Pie Charts with Values in Degrees, and Understanding Pie Charts with Values in Percentages/Fractions.
Important Questions on Circle Graph or Pie Chart
In a company there are workers of different religions. The data of the different religion are given below:
| Religion | Number of workers |
| Hindu | |
| Muslim | |
| Sikh | |
| Christian |
Represent the above data by a pie graph in degrees.
Various modes of transport used by students in a given school are given below
| Mode of transport | Number of students |
| School bus | |
| Private bus | |
| Bicycle | |
| Rickshaw | |
| on foot |
Represent the above data by a pie graph in degrees.
Draw a pie chart of the data in degrees given below.
The time spent by a child during a day:
| Activity | Time spent |
| Sleep | hours |
| School | hours |
| Home-work | hours |
| Play | hours |
| others | hours |
A study was done to collect data on the amount of homework required from students at a school in Canada.
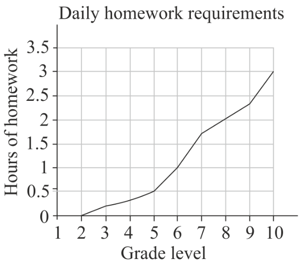
Explain why this data could not represent in pie chart.
The data below represent the participation rate in various sports based on the family's income level.
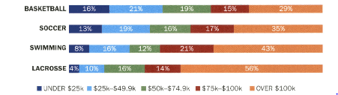
Draw multiple pie chart to represent data. ( one pie chart for each sport)
Who likes to get wet in the rain? A child made this Chapati Chart after asking his friends.
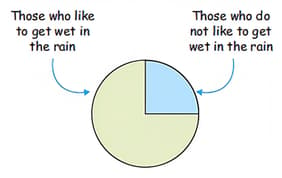
How many children like to get wet in the rain?
Time spent by a child during a day. Find the sum of fraction of time spent by child for the activities sleep, school and homework.
| Activity | Number of hours |
| Sleep | |
| School | |
| Homework | |
| Play | |
| Others |
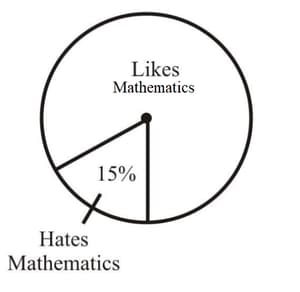
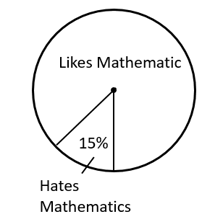
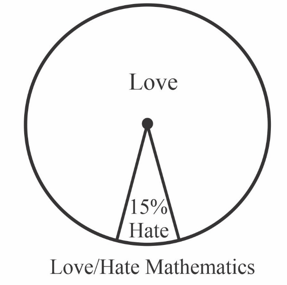
The following pie chart gives you the information about the students in the class who likes hates mathematics subject. Find the fraction of the circle representing students who hates mathematics. Write the fraction in simplest form.
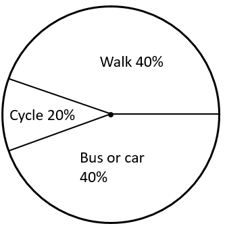
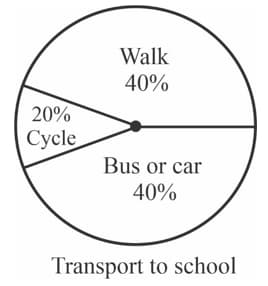
The following pie chart depict the information about the mode of transportation used by the students in a class. Find the fraction of the circle representing number of students who use cycle as mode of transportation. Write the fraction in the simplest form.
Time spent by a child during a day. if the central angle to draw pie chart for the activity homework is , then find the value of .
| Activity | Number of hours |
| Sleep | |
| School | |
| Homework | |
| Play | |
| Others |
The following pie chart gives you the information about the students in the class who likes hates mathematics subject. Find the fraction of the circle representing students who likes mathematics.
In the following pie-chart a different piece of information about your class is given.
Find the fraction of the circle representing each of this information.
In the following pie-chart a different piece of information about your class is given.
Find the fraction of the circle representing each of this information.
In the following pie-chart a different piece of information about your class is given.
Find the fraction of the circle representing each of these information.
The pie chart shows the number of students who drank water, milk, juices and soft drinks. Observe the graph.
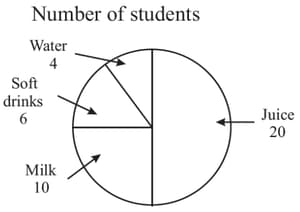
How many students are shown in all?
Given below is a Chapati chart showing the quantity of rice and pulses in a sack.
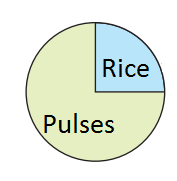
The quantity of rice is:
Flowers are planted in a circular area in the courtyard of Panchayat Bhavan. In half the area there is rose, one-third area of marigold and dahlia plants in the rest. Represent this by a pie graph.
Draw a pie chart for the following information.
| Ocean | Pacific | Atlantic | Indian | Arctic | Antarctic |
| Water |
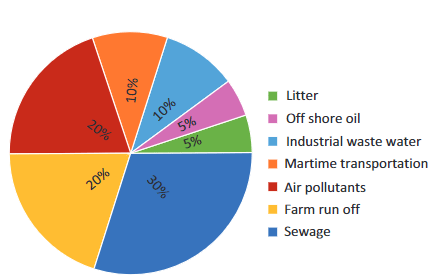
Write any five points from the given pie chart information regarding pollutants entering in the oceans.
Same pie chart can be used for different samples.


